


OpenTTD Industry/Commodity Flow Chart - Sub-arctic
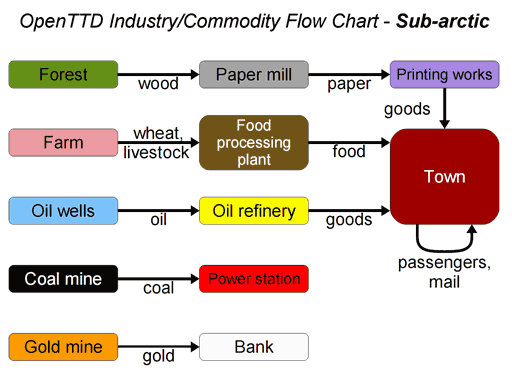
Note: Colours represent icons in Industry minimap.
(Thanks to Timwi for valuable feedback!)
Filesize: 13.35 KiB
OpenTTD Industry/Commodity Flow Chart - Sub-arctic
Note: Colours represent icons in Industry minimap.
(Thanks to Timwi for valuable feedback!)