Contents |
Overview
The amount of money earned when delivering a Cargo is determined by four factors: type, amount, distance and days in transit. In other words, it is the product of the cargo payment rate, amount of cargo, transit distance, and time factor determined by days in transit.
Before OpenTTD 1.0/r17437, transporting Valuables a distance of fewer than 10 tiles yielded no money.
The transit distance is measured as the manhattan distance between the origin station and the destination station. The implication is that you can increase money earned by intentionally building your stations further from each other (i.e. place them on the far sides of industries, exactly like you would not do in real life :-P ).
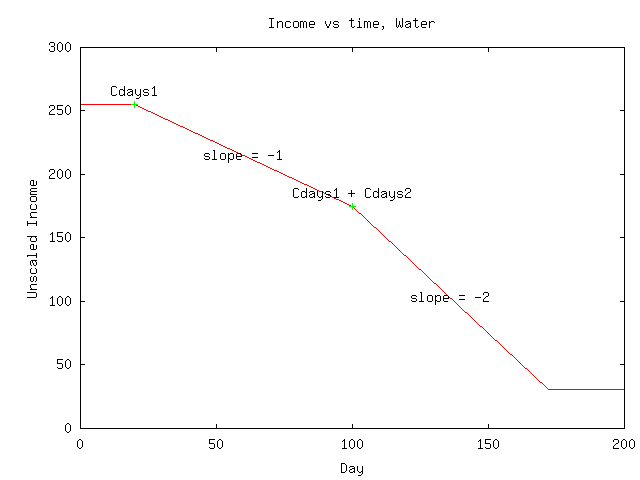
The time scaler penalizes slow transportation. Each cargo type has two numbers, days1 and days2, that determine the boundaries between "fast", "medium", and "slow".
Note: One "day" on this page is actually 2.5 days in the game. So if days_in_transit = 4, then you use 4 in the calculations that follow, but actually the cargo is already 10 days in transit.
Income(cargo, amount, distance, time) = cargo payment rate ...
This function has the following form:
Constants
| Cargo Type | Base payment rate | Days1 | Days2 |
|---|---|---|---|
| Batteries | 4322 | 2 | 30 |
| Bubbles | 5077 | 20 | 80 |
| Candyfloss | 5005 | 10 | 25 |
| Coal | 5916 | 7 | 255 |
| Cola | 4892 | 5 | 75 |
| Copper Ore | 4892 | 12 | 255 |
| Diamonds | 5802 | 10 | 255 |
| Fizzy Drinks | 6250 | 30 | 50 |
| Food | 5688 | 0 | 30 |
| Fruit | 4209 | 0 | 15 |
| Gold | 5802 | 10 | 40 |
| Goods | 6144 | 5 | 28 |
| Grain | 4778 | 4 | 40 |
| Iron Ore | 5120 | 9 | 255 |
| Livestock | 4322 | 4 | 18 |
| 4550 | 20 | 90 | |
| Maize | 4322 | 4 | 40 |
| Oil | 4437 | 25 | 255 |
| Oil (subtropical) | 4892 | 25 | 255 |
| Paper | 5461 | 7 | 60 |
| Passengers | 3185 | 0 | 24 |
| Plastic | 4664 | 30 | 255 |
| Rubber | 4437 | 2 | 20 |
| Steel | 5688 | 7 | 255 |
| Sugar | 4437 | 20 | 255 |
| Sweets | 6144 | 8 | 40 |
| Toffee | 4778 | 14 | 60 |
| Toys | 5574 | 25 | 255 |
| Valuables | 7509 | 1 | 32 |
| Water | 4664 | 20 | 80 |
| Wheat | 4778 | 4 | 40 |
| Wood | 5005 | 15 | 255 |
| Wood (subtropical) | 7964 | 15 | 255 |
Visualization
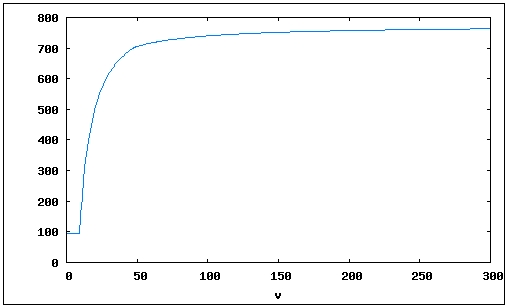
The following graph shows the income from delivering 20 passengers a distance of 100 tiles at various speeds. The vertical axis is income in £, while the horizontal axis is velocity in km/h.
As you can see, the speed of the vehicle has a dramatic effect until about 50 km/h, at which point it starts to level off. (The growth is logarithmic.) According to the equation above, the income of passengers delivered at 100 km/h equals 96.2% of the income delivered at 600 km/h. Since increasing the speed produces diminishing returns, it is often better to optimize other factors, such as the cargo capacity of a vehicle — especially when dealing with planes (each of which are far off to the right of this graph, regardless) or with shorter routes (where speed has a smaller effect, as we'll soon see).
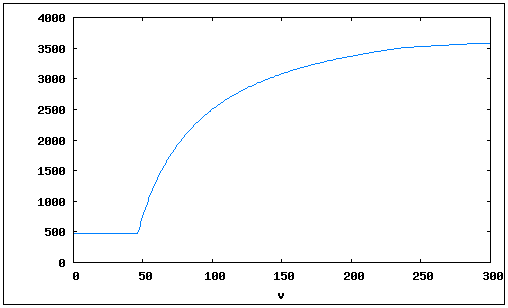
Farther distances are more sensitive to speed. Take a look at the passenger delivery over 500 tiles:
This time, income of 100 km/h is 67.1% of income of 600 km/h, which means that a faster vehicle will substantially increase our income.
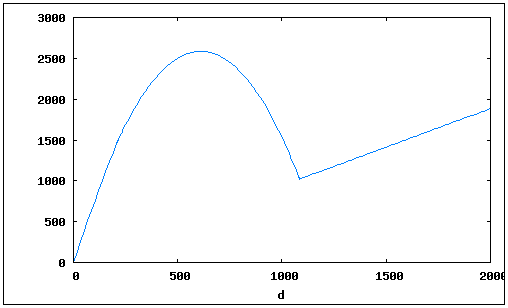
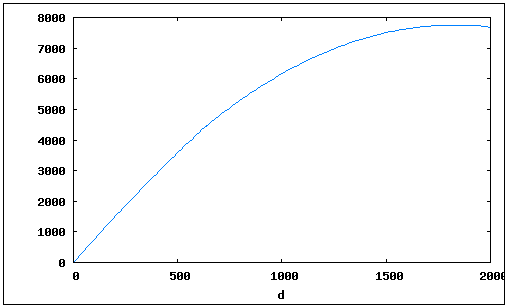
Furthermore, we get a very interesting graph when we plot distance versus income, with the same 20 passengers at a speed of 100 km/h):
At approximately 600 tiles, you will begin to make less money, because the decline in value due to the age of the cargo overcomes the growth in value due to the longer distance. Furthermore, if you pay close attention to the above equation, you will notice that if it takes too long to deliver a cargo, the time component will never be lower than 31. This implies that for very long routes, the distance component overcomes the time component, effectively making the days in transit moot. (Note that this is not the distance of the route taken, but the shortest distance between the two stations, as noted above.)
Also, if the vehicle is faster, larger distances can be reached without a dip in income. Here is an example showing the income for a vehicle with a speed of 300 km/h at various distances:
Similar graphs can be drawn in-game using the new graphs patch.


